Important DAM Metrics to Measure Performance

Being able to leverage your content from a centralized location is one thing, but being able to optimize it based on how it’s being used is another. This ability extends the value of your digital asset management (DAM) system and ensures your teams can collaborate, coordinate, and control your brand across its entire content lifecycle — from creation to archive.
Data-driven decisions are one of the key DAM success factors and should be leveraged to maximize your DAM investment. These decisions are also pivotal to your brand’s success. Informed by the right DAM metrics, you can foster a more mature brand that excels across all five brand management pillars: strategy, people, process, technology, and impact.
So how can you reap the benefits of your content data? It starts with understanding exactly what it is, where it can take you, and how to use it.
What are content analytics?
Simply put, content analytics are insights. They are organized, actionable data sets that give you intel into the performance of your digital content and how people use it.
You and your team probably access and use multiple types of content every day. From videos to sales collateral, creative files, photos, and more, you likely have loads of digital content being used throughout your organization, by partners, and across your marketing channels. But do you truly have a grasp on which content is performing well? Your teams say the content you create is helpful, but do you know what’s effective? Or more importantly, what isn’t?
Content analytics give you visibility into your content across its entire lifecycle. You can see where it’s used, when, by whom, and for what purposes. You can see at which point it stops doing its job, so you can improve. And since your DAM system is (in one sense) the watchful guardian of your content, you have eyes everywhere. You can see what content is going in and out of your system. You can see how people search for assets, if they find them, and if they don’t. All of this knowledge is, as they say, power.
Benefits of collecting content data
As you’re probably gathering, there are major benefits to collecting performance and usage data about your content. For one, you can see what is working and not working, so you can adjust. But there’s more to this. With content analytics, you can justify and inform high-level, strategic business decisions.
For example, you can:
- Steer your marketing budget by understanding when, where, and why people access your content. For instance, if you see that users in one country leverage campaign content more than other regions, you can allocate budgets to support this demand and reevaluate what’s needed in other locations.
- Reduce costs. Let’s say you’re spending a lot of money on developing a series of videos for a new product launch. You’ve only created two videos so far, but your DAM analytics tell you that nobody is making it past the first 15 seconds. Rather than paying for expensive, long-form videos, you can trim costs and adjust your strategy to focus on shorter, more efficient video investments.
- Justify your investment in DAM technology and get buy-in for expanding your system’s capabilities and applications by proving the return on investment (ROI). There are many variables to consider when calculating the ROI of your DAM system, one of which is time savings. Consider a scenario where you have four people spending four hours a week searching for digital assets. At $25 per hour, that’s $20,800 per year in savings that can offset the cost of your system. And keep in mind there are other ROI factors to consider too!
- Monitor the health of your DAM site so you can get the most value out of it. For example, if you notice people use different search terms to look for assets than you originally thought, you can improve search results by adjusting your metadata to ensure your system returns the best assets for the job.
- Plan integrations with other tools. What kind of assets are used across your marketing and creative teams? If your web team is spending time updating every little change to web images and resources, you may want to connect your DAM platform with your content management system (CMS) so assets automatically update based on what’s in your system. Or are your sales teams active DAM system users? This may justify an integration with your customer relationship management (CRM) platform, so sales teams can search, select, and share assets with prospects right from the CRM system.
What to look for when collecting your data
Data for the sake of data won’t get you anywhere. To harness the power of your content analytics, you need to trust the data and your interpretation of it. To do this, your data must check the box in three areas: accuracy, validity, and reliability.
- Accuracy is the extent to which a sample size obtained can be generalized. Unfortunately there’s no hard-and-fast rule to apply, but in general the larger the sample size, the smaller the margin of error. An asset group that’s available to 300 users is going to tell you much more than one that’s only available to 10.
- Validity is the extent to which a measure of data is relevant to your research question. If you’re trying to determine the optimal length of video content, looking at the number of video views isn’t going to give you the visibility and insight that a video retention rate (with viewer drop-off points) will.
- Reliability is the extent to which a data source can be trusted, or depended upon. Of course you want to ensure that the systems you use to collect and analyze content data are reliable. But more so, if data looks off or appears too good to be true, you need to dig deeper to determine if something else is at play. Data sources play a big part in reliability as well. While automatically populated data tends to be more reliable than manual information, it’s always good to validate all of your data sources regularly. As with all data, trust your instincts.
Examples of content analytics and DAM metrics you should track
When it comes to DAM content, teams want answers to a wide range of performance and usage-related questions. Where is content being viewed? How often is it shared? What are teams using it for? What content is most popular? The questions go on and on, but with the right metrics you can find the answers you need. Here are four data categories, and the metrics that fall within each.
Individual asset data
Detailed data about a single asset, such as a photo or marketing brochure, gives you granular insight into the effectiveness of a particular asset and can help you identify the best and worst performers. Typical metrics give insight into:
- Downloads
- Share and embed views
- Intended use (e.g., in advertisements, emails, or social media)
Group asset data
When you have a group of assets that are similar, part of the same campaign, or were created together to help you obtain a particular goal, a high-level snapshot of their overall performance and adoption is helpful. DAM features and products that allow you to group individual assets together in collections or curate and share asset groups on simple microsites, like portals, open you up to metrics like:
- Portals (or microsite) views
- Collection usage
- Downloads within an asset group
- Top downloaded asset groups
User activity
Understanding who uses your DAM system and how they use it can help you intercept issues and inform optimizations. With visibility into user activity data, you can determine where to push adoption efforts or spend time training users. You can follow usage patterns and cater file formats and content types to your users’ preferences and needs. Here are popular user-specific metrics:
- Logins
- Geolocation
- Intended use
- System maintenance/admin notifications for system issues like conflicting assets or missing metadata
Search data
With the right DAM system, users can search how they want to search — by category, keyword, filter, featured results, and more. Understanding user preferences helps you optimize the setup of your system to better connect users with the assets they need. Key insights include:
- Search queries/keywords (what users are searching for compared to your taxonomy)
- Search type
- Successful and null searches
- Geolocation
Take an in-depth look at how content and asset-level analytics can provide major visibility for your organization.
Using data to inform your content strategy
Your content strategy is your guiding light: the grand vision that steers the development, delivery, and management of your content. To know where you’re headed with all of this, it’s important to let data inform your best path forward.
Review your global content goals. What are you trying to achieve? If one of your goals is to drive more qualified sales leads, think about how content — and what you know about your content — can help you get there.
Then, before you dive headfirst into your content analytics looking for answers, take a step back. Ask yourself questions about what you’re looking for. What kind of resources are your buyers most interested in? What content does your direct sales team leverage the most? Then formulate a hypothesis for each question, and use your data to prove or disprove your thinking. This scientific approach to data analysis will keep your research focused and prevent you from getting caught up in webs of data.
There are a lot of success stories about organizations leveraging their DAM system to achieve business goals, avoid missteps, remedy challenges, and ultimately inform their content strategy. Here are some examples of companies doing just this by leveraging their content data to tell a story and move their business forward.
Hootsuite: Through an integration with their CMS, Hootsuite pulls visual content like white papers straight from their DAM system to their website. This reduces the back and forth between teams when there are minor changes to marketing materials. It also allows Hootsuite to track views and downloads of this content in their DAM analytics to better inform their content strategy.
Varian: Monitoring their user data regularly allowed Varian to quickly catch illegal content usage from a user at an approved vendor, saving them thousands of dollars in stolen brand assets.
Where to get your DAM data
Part of understanding data analytics is being able to differentiate what it is and isn’t telling you. Different data sources provide a distinct way to look at things, so it’s important to understand what you’re looking for and the best place to find your answer.
Insights app
Our DAM platform, Acquia DAM, has analytic tools in the Insights application. With Insights, you’re able to create standard and custom dashboards with the reporting information you need to analyze and assess your content and site performance. Some of the analytic features in Acquia DAM include:
- Sitewide insights: A comprehensive look at your DAM site performance and user engagement with data on searches, shares, embeds, views, downloads, and more.
- Asset insights: An at-a-glance view of asset activity and engagement that helps you share, publish, and repurpose your team’s strongest assets.
- Intended use: A feature that tells you the who, where, and how about content being repurposed, downloaded, or shared, so you can identify which assets are overused or where the greatest opportunities lie.
- Search results sorting: Options that let you sort and filter digital assets more quickly through a number of approaches, including by download count, engagement score, site view count, and others.
- Data exports: Handy excel exports with user info, metadata, order and upload history, and other information to help you drill down into site activity.
Google Analytics
Google Analytics is a web analytics service that tracks and reports website traffic. When paired with Insights, it can provide you with information about your users that is typically not available in your DAM system. For example, you can access the following supplemental data about your users and their behavior:
- User type (new versus returning)
- Browser
- Browser language
- Operating system
- Mobile device (e.g., Apple iPad, mobile phone)
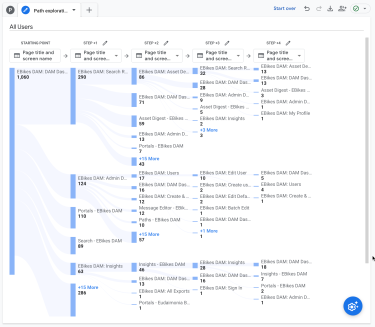
- Path exploration
This information is helpful for many reasons. One example is that it provides clarity around what Google Analytics calls “path exploration.” This data highlights the pages users visit during a website session. This is valuable to understand because you can glean insights into how users behave within your DAM site, and use this information to improve the experience. For example, if you see that your DAM users continually bounce from the dashboard to a search result page and back again, this may indicate that users aren’t getting the search results they expect, and you need to improve your training or even put in some metadata work. Or if you see a large volume of drop-offs at the login page, this may indicate that more people want access to your system. Combining the information from Google Analytics and the user data in your DAM system, you have a lot of actionable data at your fingertips!
Do you need greater DAM visibility?
It’s easy to get stuck in the cycle of creating content without really knowing if it’s performing well or if your people have what they need to move your business forward. But to fuel a successful and mature brand, you need visibility into your content and DAM efforts so you can make decisions based on actual data.
You may know with the utmost certainty that you absolutely, positively need greater visibility into your DAM efforts and content lifecycle. Or it might not be that obvious. If you’re still uncertain of where you fall, revisit your content goals. What do you want to achieve? Furthermore, how will you achieve it — and how will you measure it?
If the “how” to your content strategy isn't informed by data or you don’t have deep enough insights into your content performance to answer this question, it might be time to reassess where you get your DAM data. As we’ve seen, performance metrics can be extremely valuable — they give you the information you need to distribute content strategically and effectively across your channels.
Wondering how Acquia DAM can help you reach a game-changing level of metric visibility? Request, watch, or click through a demo today!
Note: This article was originally published in 2020 and has been updated to remain current.

Sr. Manager, Product Marketing Marketing Acquia


